

Manufacturing KPIs: which ones to actually monitor
Manufacturing kpis: which ones to actually monitor (and which to stop watching)
In most of the plants we enter, manufacturing kpis already exist. The problem is different: there are too many of them, they arrive late, and no one knows which number to look at to make a decision anymore. As a result, the dashboard stops serving as a decision-making tool and becomes a mere habit: commenting after the fact on what happened, when it is already too late to intervene. This article explains which manufacturing indicators are truly useful, how they are calculated, which ones only create the illusion of control, and how to transition from measurement to decision-making.
The problem isn't measuring too little: it's measuring poorly
In the production dashboards we happen to review, there are often dozens of indicators. It seems like a sign of maturity. In practice, here is what happens:
- each department brings its own numbers, calculated using different formulas, and meetings turn into debates over which spreadsheet is right;
- indicators arrive retroactively, on the 10th of the following month, when the problematic order has already been delivered late;
- no single person is held accountable for a given indicator, so no one takes action.
A kpi that doesn't change a decision isn't a kpi: it's just a number. The selection criterion, before discussing technology, is this: what question does it answer, who needs to make that decision, and at what frequency?
The "four kpis" every manufacturer needs (plus one for management)
Beneath the many possible metrics, there are four that cover the essential dimensions of any manufacturing process: efficiency, speed, quality, and reliability. If you have to start from scratch, start with these.
1. Oee (overall equipment effectiveness) measures how much of the theoretically available capacity is converted into good-quality products. It is calculated as the product of three factors:
oee = availability * performance * quality
- Availability = actual operating time / planned production time (captures stoppages, breakdowns, setup)
- Performance = (produced items * ideal cycle time) / operating time (captures micro-stoppages and slow speed)
- Quality = first-pass good items / total items produced (reworked parts count as losses, not good parts)
The absolute value matters less than you might think: a 65% oee on a bottleneck resource is a serious issue, whereas that same 65% on an underutilized machine is almost irrelevant. What truly matters is the breakdown. Knowing whether you are losing ground due to downtime, speed, or quality completely changes the action required: an oee reported as a single isolated number, without its three underlying factors, is virtually useless.
Beware of the most common calculation error: if you calculate availability based on calendar time instead of planned production time, oee plummets artificially and becomes incomparable to any external benchmark.
2. Production lead time the time elapsed between the opening and closing of a production order. This is the portion of lead time directly within your control; what the customer perceives is broader, as it also encompasses order processing, material procurement, and shipping. It also determines how much capital remains tied up in work-in-progress (wip).
It should be compared with takt time, which is available time divided by required customer demand. Takt time is not a performance indicator: it is the target rhythm the flow must maintain and serves as a benchmark. Lead time should then be broken down into actual processing time and waiting time. A core principle of lean literature is that in discrete manufacturing, the time a part is actively being worked on is a tiny fraction of its total throughput time; the rest is queue time. The lever governing that queue is the quantity of wip in circulation, not machine speed, as expressed by little's law:
lead time = wip / throughput
3. First pass yield (fpy)
fpy = first-pass compliant items / total items started
The quality factor of oee and first pass yield measure the same dimension across different scopes: the former on a single machine or line, the latter across the overall process flow. If you track both, maintain them for their respective scopes rather than treating them as two independent metrics.
Do not confuse fpy with final yield. Final yield includes parts recovered through rework, thereby hiding the exact cost you need to see: labor hours, machine occupancy, and materials spent twice. That is the cost of poor quality, which in many companies doesn't appear in any report because it is spread across different departments.
Pay attention to scope: across a multi-stage flow, a single consolidated fpy cannot be calculated directly. It must be measured per stage and then combined by multiplying the individual values (rolled throughput yield). Four stages operating at 95% each do not result in a 95% total yield; they equal 81%, and that drop represents the true measure of what poor quality is costing you.
4. On-time delivery (otd)
otd = order lines delivered by confirmed date / total order lines
This is the one kpi on this list that customers measure directly. Three nuances substantially alter its result:
- measure by order line, not by total order. On multi-line orders, the difference is massive and almost always skews toward the worse outcome;
- decide whether to require complete quantities. If required, you are measuring otif (on time in full), which is stricter and closer to how the customer experiences fulfillment;
- measure against the first confirmed date. Rescheduling internally and re-confirming to the customer resets the counter and yields an artificially improving metric while service actually deteriorates. This is why sales and operations often have opposing perceptions of the exact same month.
For executive management or a controller, a fifth indicator should be added to these four, one that rarely exists in a reliable form: actual vs. estimated unit product cost. This serves as the bridge between shop-floor data and the income statement, and it is frequently where data availability falls short.
Indicators that seem useful (but aren't)
Certain widespread kpis encourage behaviors that ultimately degrade overall business performance:
- Individual operator productivity: drives local optimization: each station maximizes its own output, overall flow slows down, and wip inventory inflates.
- Pushing machine utilization toward 100%: a non-bottleneck machine operating at 100% isn't creating value: it is creating inventory. Saturating every asset is the fastest way to lengthen lead times, a core insight behind lean manufacturing.
- Total unit counts without accounting for product mix: a month yielding 10,000 simple items vs. a month producing 6,000 complex items cannot be compared directly. Without normalizing for product mix, trends are mere noise.
- Any indicator that arrives too late for action: monthly data on a process decided shift-by-shift holds accounting value, not operational utility.
The weakest link isn't the metric: it's the underlying data
This is where most kpi projects stall. Writing down an oee formula takes thirty seconds; feeding it daily with reliable data is another story entirely.
If downtime is logged manually by operators on paper at the end of a shift, you aren't measuring downtime: you are measuring memory at shift-end. Relying on manual spreadsheet consolidation introduces three structural flaws:
- Insufficient granularity: you know the line lost two hours, but not the root cause codes;
- Latency: the data becomes available long after its operational window has passed;
- Lack of a single source of truth: every department maintains its own file, leading to conflicting numbers.
This is the role of a manufacturing execution system (mes): collecting data right where it originates, at the moment it happens, with cause codes attached.
read: how to choose an mes or roi of an mes
An honest warning: not every company needs to start here. If you operate on a single production line with few skus and low volumes, a well-structured semi-manual tracking process can suffice for a year or two. The issue becomes critical as department count, product mix, or delivery deadline pressures scale up.
From indicators to decisions: who looks at what?
Having data doesn't mean knowing how to use it. The practical core is organizational, not definitional: the same metric serves three different roles in three different formats, while maintaining overall coherence.
- The shift supervisor needs real-time data on the current shift and downtime reasons right now.
- The operations director needs 3-month rolling trends broken down by department and product family.
- The cfo needs job profitability, which requires combining production, sales, and cost data, information that resides in the erp, not the mes. read: erp vs mes
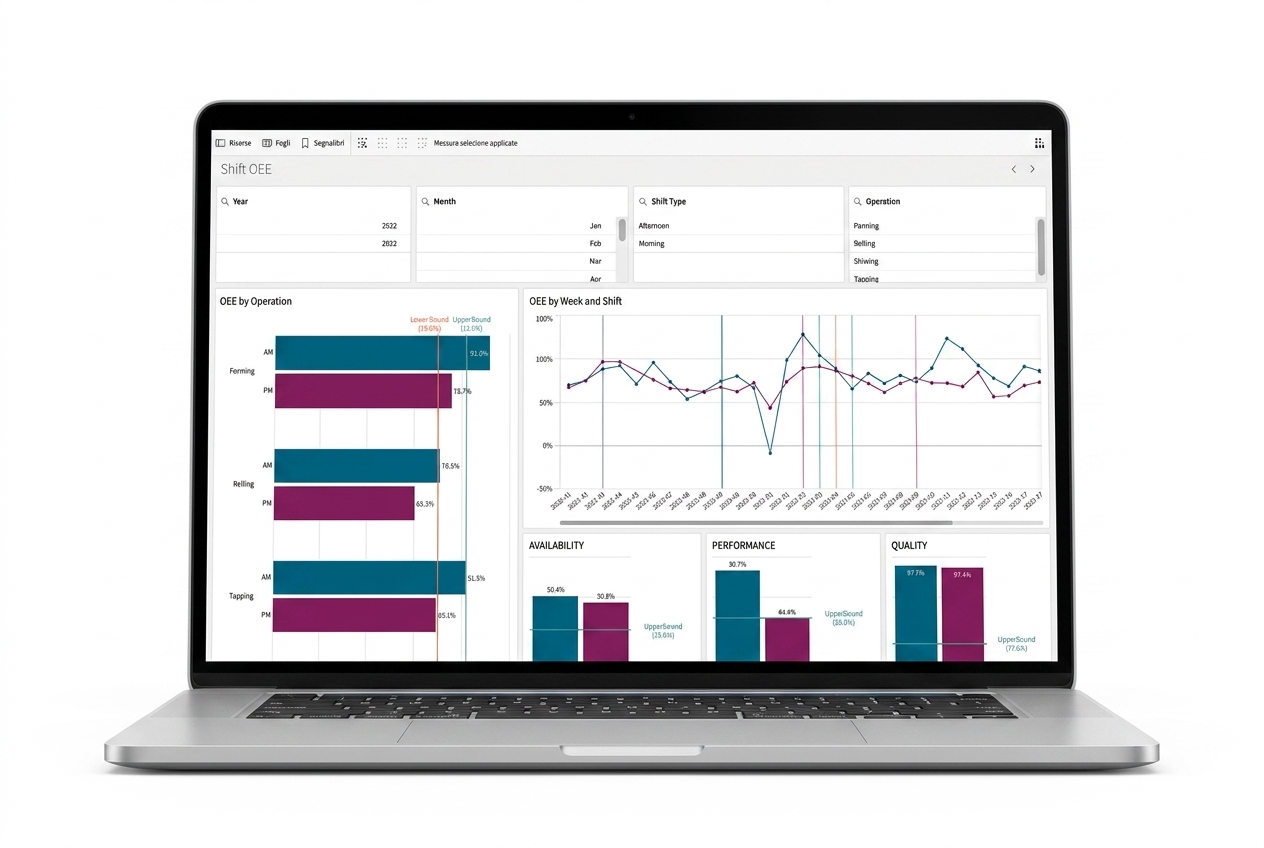
A Business Intelligence (bi) platform brings these three perspectives together under a single, shared definition for every metric
How to choose your kpis: five steps
- Start with the decision, not the data. For every candidate metric, write down what specific decision it will alter. If you can't define it, eliminate it.
- Limit yourself to 5 or 6 metrics per organizational level. One per dimension: efficiency, speed, quality, reliability. Beyond this limit, focus scatters.
- Document the exact formula. Numerator, denominator, scope, data source, and who calculates it. Most disputes over "which number is correct" stem from two departments calling different things "oee."
- Align frequency with action. If the decision occurs shift-by-shift, the data must be available per shift. If it's a budget decision, monthly reporting is fine.
- Set a target and give it time. An internal continuous improvement target is far better than an imported industry benchmark: it starts from where you are today and avoids debates about comparability.
How we approach it at Advinser
we guide manufacturing and fashion companies through this transition in two sequential steps:
First, the data: /.MES captures progress, downtime cause codes, scrap rates, and cycle times directly from the shop floor, while performance analytics modules deliver operational metrics to the team right when they are needed.
Second, the interpretation: We build models and dashboards in qlik (or power bi where appropriate) that seamlessly integrate production, erp, and commercial data under a single metric definition with role-tailored views.
Order matters. An elegant dashboard built on poorly collected data simply generates wrong decisions faster than before.
Want to determine which kpis make sense for your plant?
Frequently asked questions about manufacturing KPIs
How many production kpis should i monitor? five or six per organizational level. A shift supervisor and an operations director should monitor different indicators, not the same dashboard packed with extra rows: multiply the tailored dashboards, not the metrics inside them.
What is the single most important manufacturing kpi? there isn't one absolute answer: it depends on your current primary constraint. If capacity is your bottleneck, focus on the oee of that constraint. If customer service is lagging, focus on on-time delivery. If margins are hurting, focus on actual vs. budgeted job costs.
Can i calculate manufacturing kpis using excel? to get started, yes, there is nothing inherently wrong with that. However, limitations arise on three fronts: the labor time manual entry consumes, the lack of root-cause data behind numbers, and the tendency for departments to create diverging spreadsheet versions. When meetings revolve around debating which file is correct, the spreadsheet has outlived its usefulness.
How often should manufacturing kpis be updated? at the exact frequency of the decision they support. Machine downtime and job progress are needed in real time or per shift; efficiency by product family makes sense weekly; job margins and product costs belong on a monthly cycle.
Where should we start if we currently measure nothing? start with a single department and two core indicators, such as the oee of a critical resource and on-time delivery. A project that attempts to cover the entire plant with fifteen indicators right out of the gate usually stalls before delivering results.